I am starting a training block where I am trying to complete all the streets in my city but had a question. I know I can see my map based off of a date but I was wondering if there is anyway I can view all stats (streets complete %, miles, streets, etc.) like I can see in my profile but starting at a select date. That way I can look at completion percentages and mileage of only this training block rather than my entire life map. If I can and I missed it I am sorry! Just started using this a few days ago and I think I tried everything but maybe not.
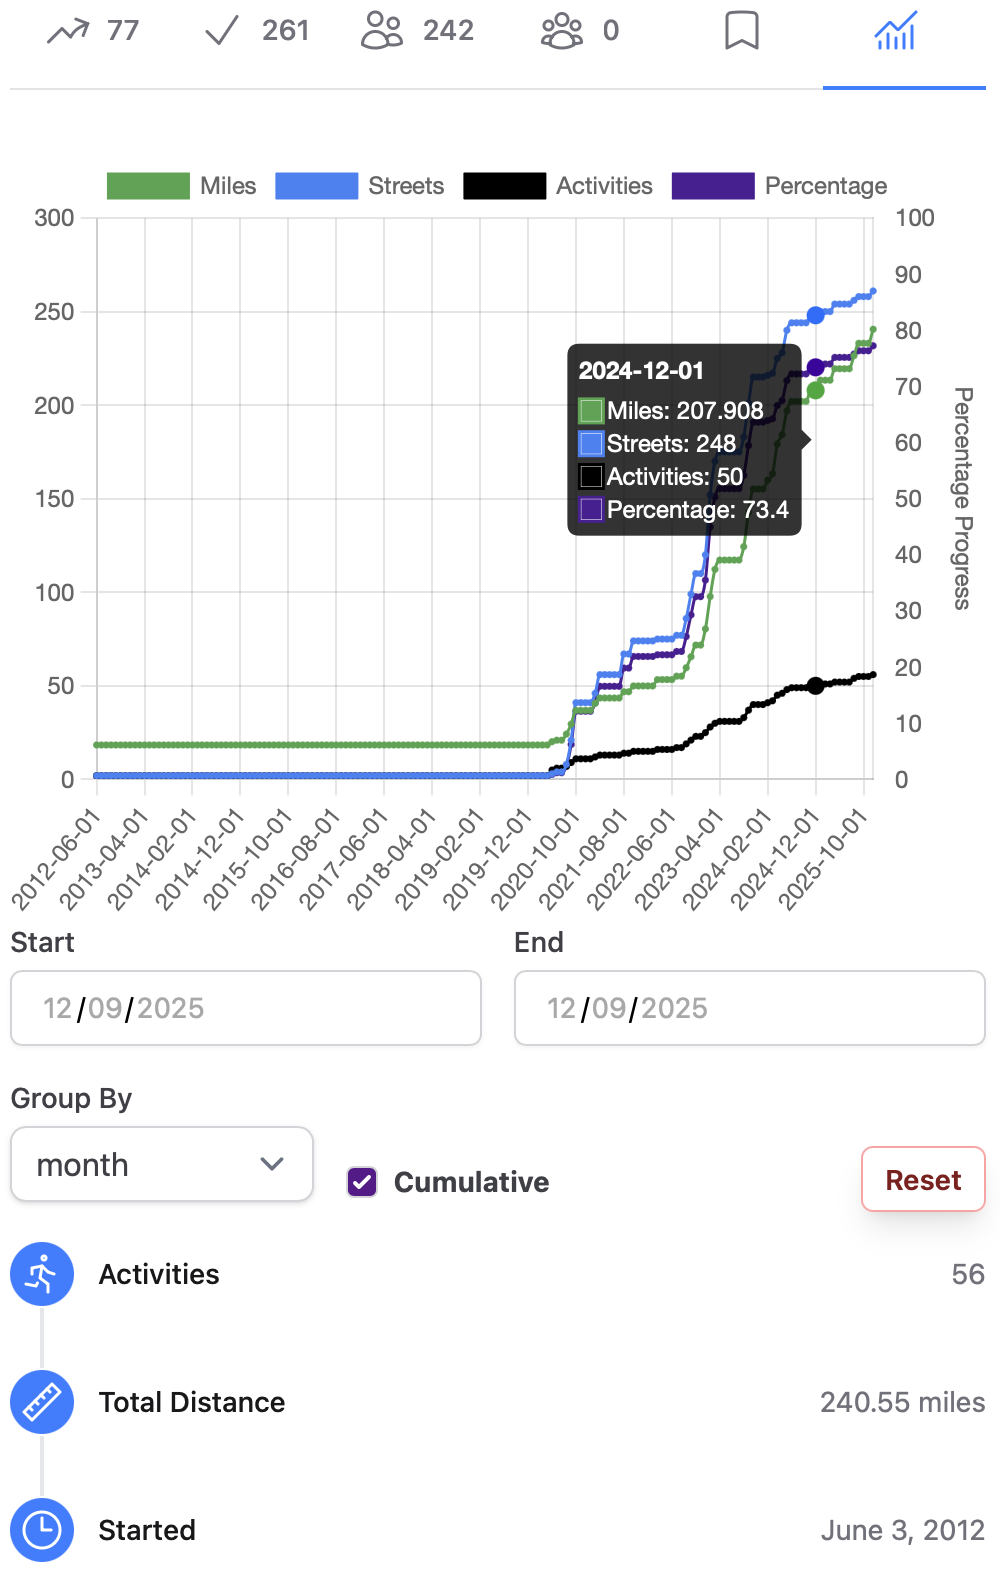
Yeah, in the far right tab on your city page (when you visit the city from your profile). There’s a chart (that may be a little slow to load) and then some basic stats below that.
It’s the same chart that’s in your profile page, but with all the data scoped to the specific city.
It does look like the percentage value in the chart gets thrown out of whack after a date range is selected. It might be calculating the percentage specifically within that time period, even if it includes today. I’ll need to look into that…
Ahh I see that. Was also hoping to see stats like the picture below for the date range and maybe I am missing it. Again sorry if I missed it and thanks for the quick response!
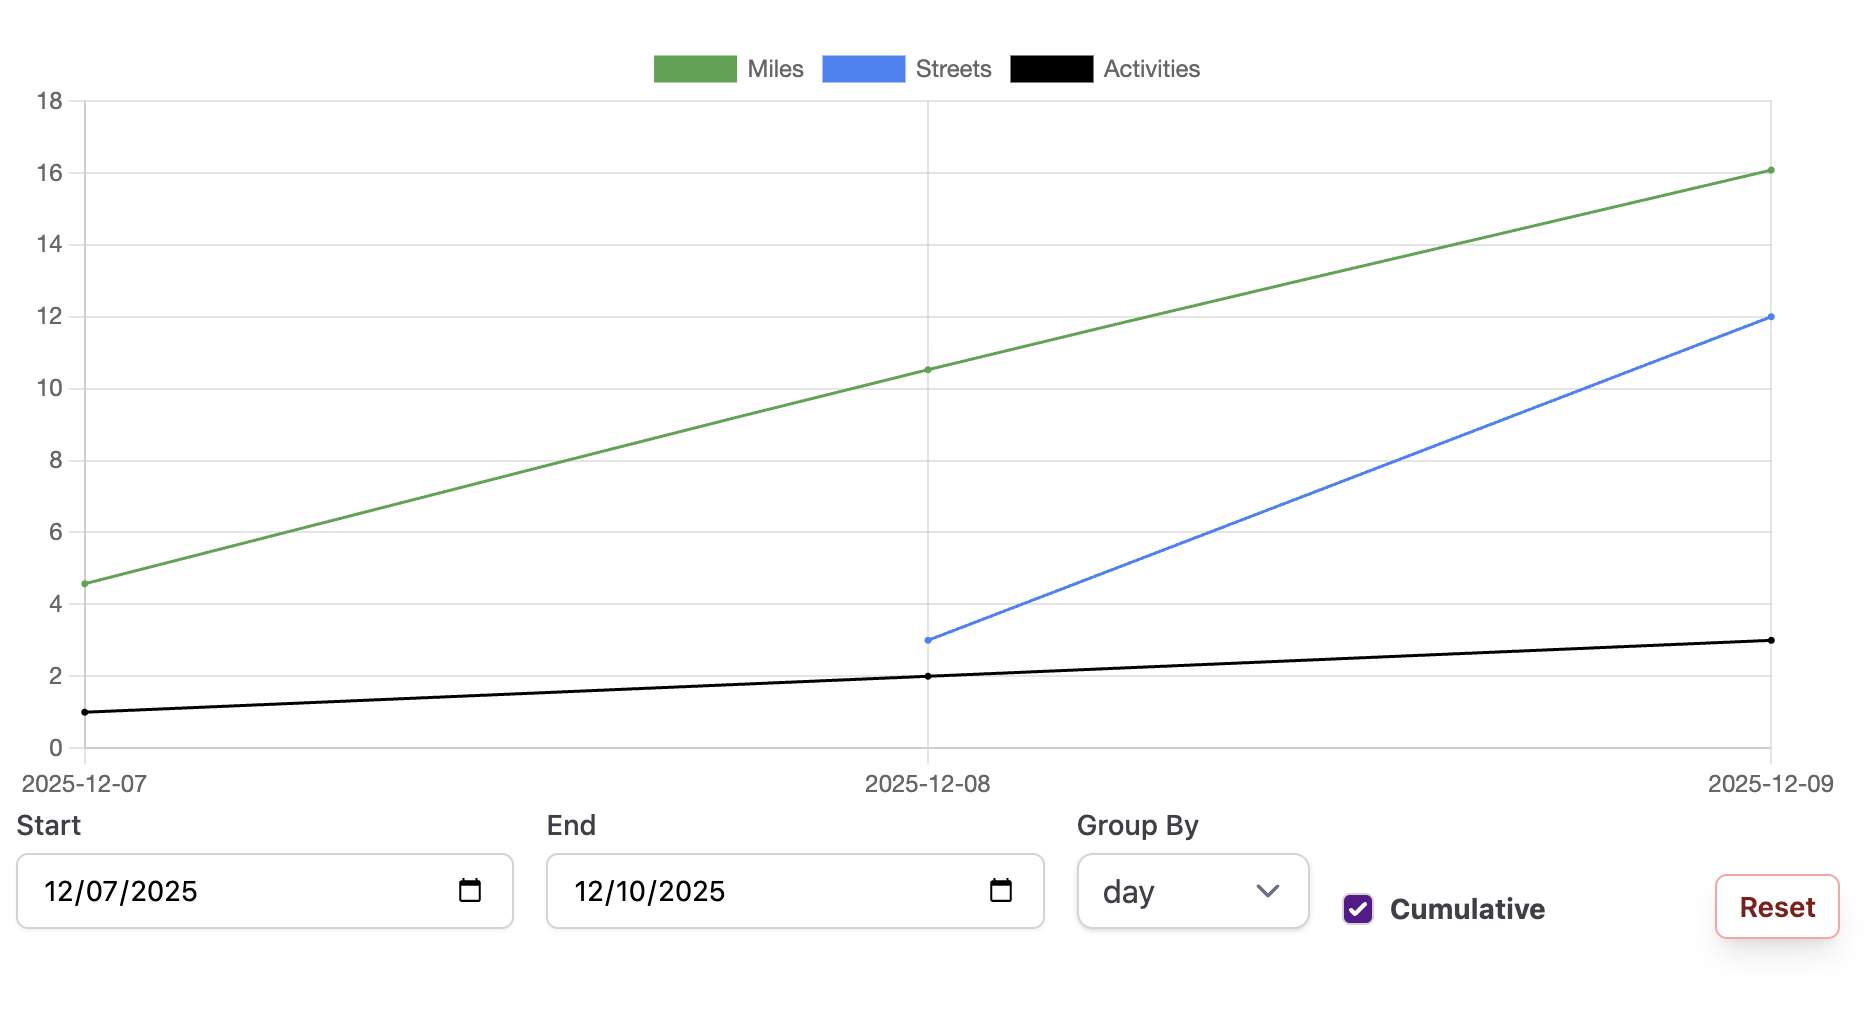
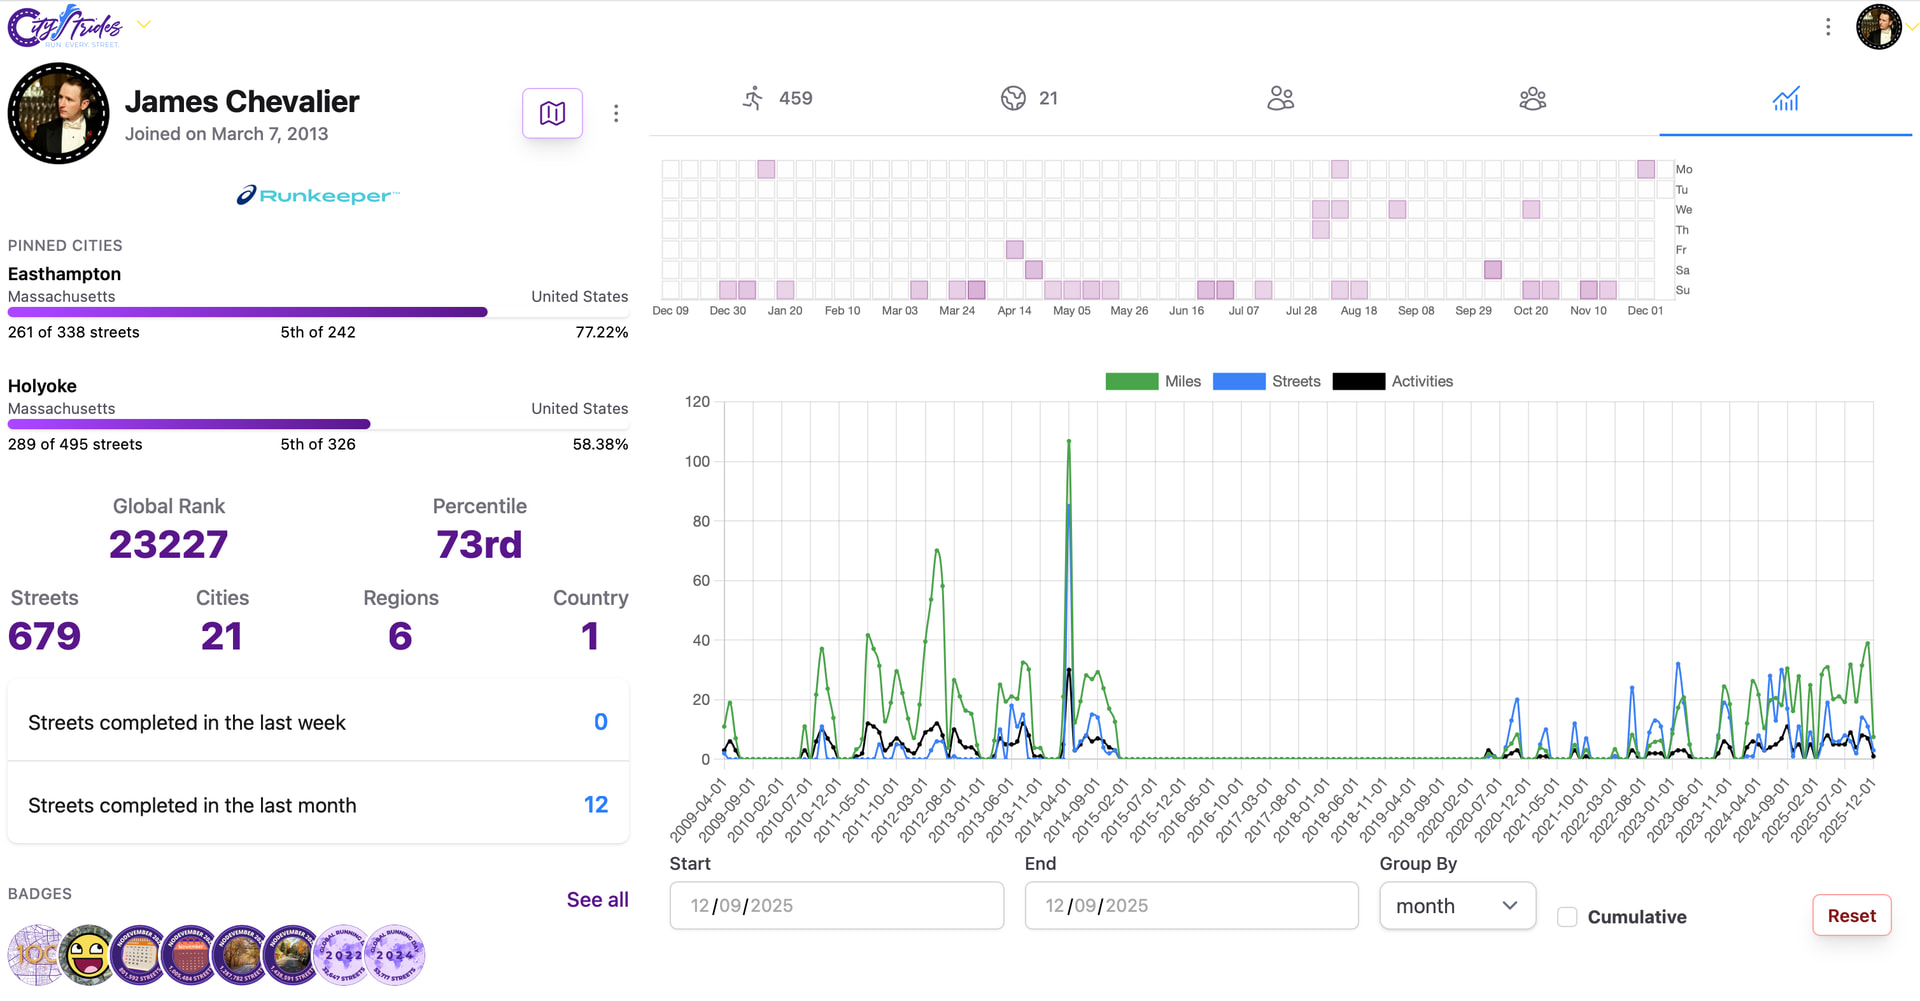
A static bar chart like that won’t work for a date range, so I went with a line graph that displays the data for the chosen range. Here’s mine in Easthampton, MA:
Here is my chart. I only started a few days ago so maybe there is not enough data but I don’t see some of data you have. But the chart you linked is exactly what I am looking for! Again thanks for the quick response!
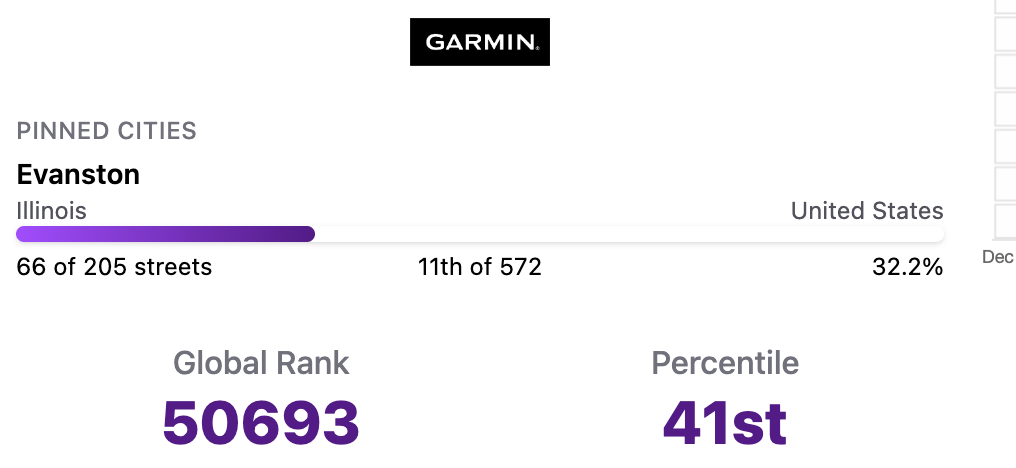
If you click through a city from your profile page & open that right tab in that page, it should include the purple Percentage box & the right axis should be labeled “Percentage Progress”
I think you’re right that the charts will get more detailed as either your history syncs in (with the caveat around Garmin’s recent Fun™ change) or as you complete more activities.
Update: I just found you in the site & your data isn’t private, so I could poke around.
You just need to click the “Reset” button in the view you shared - it’s currently filtered to just this past few days, but the default looks like it goes back to 2021.
Your chart in Evanston is similarly filled out back to that date.
I see where I went wrong. I was looking at the wrong page to get the chart. Looks like the charts will just get better as I get more data. Started my real “run every street” goal on the 7th. I guess I could also go and delete all activities before I started to get the data that way. Wish I found this sooner because I would have geeked out more on the streets I run since I run heavily on the same handful of streets/routes!
By removing your history, you lose out on your full LifeMap Poster and all future features that may use that data.
If you’re looking for a time-based approach to completing a city, check out Challenges.
Also, for your case specifically, Garmin makes syncing quite difficult. I won’t be able to resync those older activities if you change your mind in the future.