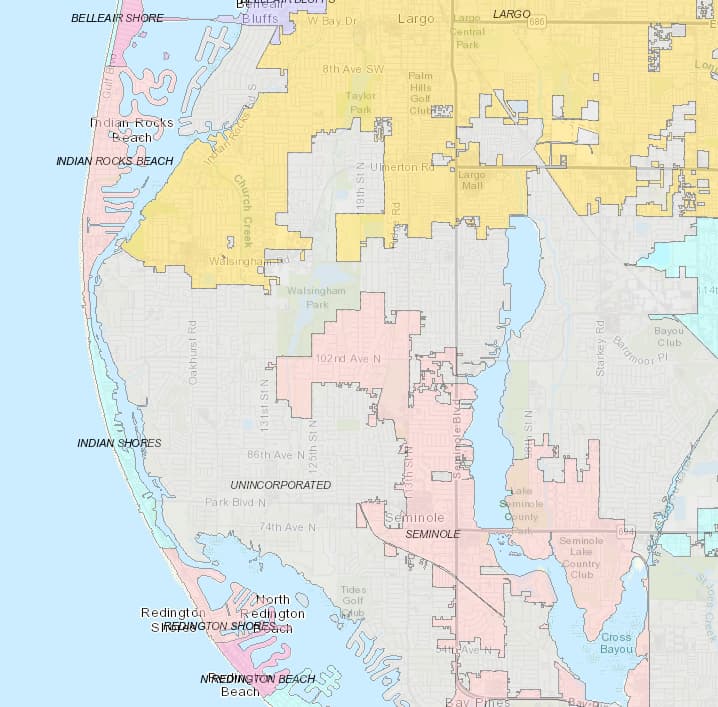
It’s really interesting to me that there is vast amounts of developed land in these unincorporated areas. Dug around about on the county’s GIS portal - I assume you are interested in adding the gray areas in the picture below?
This page is a good resource for understanding how boundaries should be mapped by state. Unfortunately it doesn’t look like there are any clear answers about unincorporated areas. If each area has its own name, then in my opinion it is valid to add them. This is something that is probably worth asking Florida mappers about (there is an OSM Slack, you could ask in #local-florida).
Regardless, here’s some guidance on how to do the actually mapping.
-
Confirm the data is compatible with the OSM license. I’m not familiar with your local laws, but just because the data is public does not mean it can be added to OSM. This is probably something the local community can help with as well, or if not, you can always contact the county and ask.
-
Download and get familiar with JOSM if you’re not already. Mapping boundaries and dealing with relations is really difficult with iD (the online editor). Also - this map style is incredible useful when mapping boundaries.
-
Understanding relations and specifically boundary relations is necessary. It’s a different type of OSM object. You can think of it as a ‘bucket’ that you can put nodes (points) or ways (lines) into to relate them to each other.
For boundaries, imagine a square boundary like below. You want to map the green boundary. Each side of the square would need to be its own way. The top line would be added to the pink ‘bucket’ and the green ‘bucket’ because it represents both the boundary of the pink area and of the green area. Similarly, the right side of the square would need to be put in the green and purple ‘buckets’ (relations).
 .
.
With all that being said, it does not look like existing cities in your area are mapped this way. In your area, the green square has one single line going all the way around and is put only into the green ‘bucket’. The other squares also have a single line going all the way around their own boundary and are again, only put into their own bucket. This is not necessarily wrong, but can be frowned upon because you are duplicating data (each side of the green square is now drawn twice). Hopefully that distinction makes sense. I am going to type out instructions as if you are mapping the first way because I believe that is better practice, but this is something you could ask the local mapping community.
So to start, you can download data for the area you are mapping in JOSM (this should be straightforward once you’re familiar with JOSM).
Then, you can open your shapefile using JOSM, which will show you the data from your file in a new layer. Then you can overlay the shapefile onto the existing data (and imagery if needed). This will help you determine which boundaries currently exist and which need to be drawn.
You will have to create a new relation object for the boundary you are drawing. On this new boundary relation, you add the tags (name=, admin_level=, etc.). Then you can start putting things into this new ‘bucket’ you created.
If the boundary line is not yet drawn, it’s relatively simple. You can trace the boundaries from your shapefile onto the ‘Data Layer’ you downloaded from OSM and add it to the correct buckets.
If some of the boundary line is already drawn (where the city/town/county boundaries already exist), you will want to use those existing lines. These lines should already be in the city/town/county ‘bucket’, you just need to add them to your new ‘bucket’. You will likely have to split the existing line into separate ways to appropriately assign them to their relations. There’s an example of this in the wiki link above.
Once you have added all the lines of the boundary to the bucket, it is drawn and you can upload to OSM. Before uploading, you will want to confirm that the boundary is completely closed (the map style linked above helps with this). I will leave it up to you and the local community to decide whether you should map this way or match the existing method. The existing method is much simpler, but is a similar process, you will just draw the complete boundary as a single line and add the single closed line to the relation.
Here is an example that I drew for reference: Relation: Middleville Township (13381376) | OpenStreetMap On the left, under members, you will see 6 members. Each of those members is a unique boundary line between two areas.
Hopefully that’s not too confusing despite the wall of text.  It’s really not that complicated once you understand what relations are and how to use JOSM. Best of luck!
