Updates from October

  • Fixed street count for cities
  • PostgIS upgrade
  • Updated Mapbox to 0.50.0
  • Display the street count for each user in their city page, so you can see their percentage complete as well as the number of streets completed in that city
  • Updated the site to handle Strava’s new authentication system

Also a pretty big change to the navigation & mobile layouts. I intended to add another announcement thread for that, specifically, but conversation has started to add up here for that … so I’ll just note that here as well. :smile:

1 Like

Looks like there is a JS error on the activities view for document.getElementById('rerun').onclick = function()... due to their not being a rerun element in at least my logged in view. This causes other functionality to break, like clicking on a road to see the completed nodes.

Argh! Thanks for reporting this … looking into it now.
This also might shed some light on another reported issue…

OK @brettajohnson … how’s that working now? :crossed_fingers:

Working now! Thanks!

1 Like

I really like the new menu, works really well on mobile. And fullscreen lifemap on mobile is very nice.

Would it be possible to split the streets in 3 categories.
Streets run, Streets left and a new category for streets that are completed but still have red nodes.

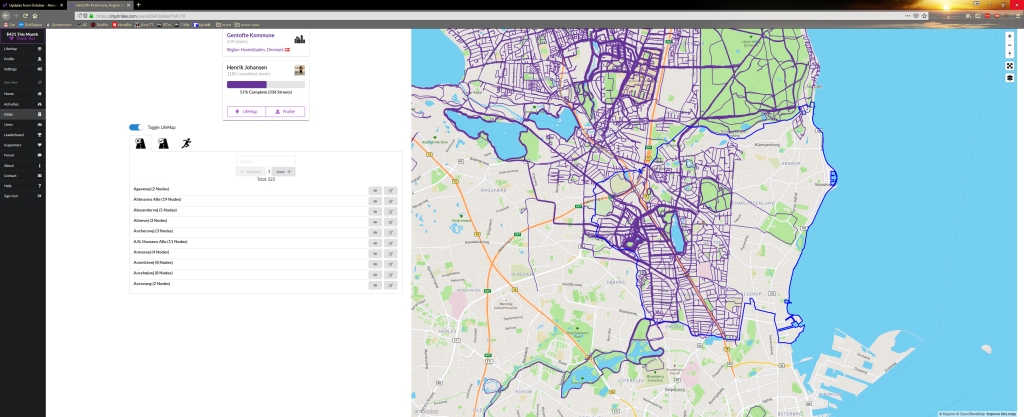
Would it be possible to lock the max width of info column in cityview, so it doesn’t scale when maximizing window.

I have a ton of trouble around SemanticUI (the CSS framework I’m using) and Mapbox (the map provider I’m using) in getting a statically-placed map alongside a scrolling column while also retaining all the grid capabilities from SemanticUI and using a fixed left navigation.

The approach I opted for puts the left navigation in a “two wide” column, and the entire right side of the page into a “fourteen wide” column. Within that “fourteen wide” column, the scrolling text is in a “five wide” column and I’ve hacked out a space for the map within an “eleven wide” column (but really it’s just fixed into place and takes up the same amount of space that the “eleven wide” column would take up).
So at larger views, that “two wide” column for the navigation grows and grows … and at smaller views it shrinks and shrinks … both cause weird issues.

I might be able to use SemanticUI’s device visibility to use different layouts at different sizes…
Or figure out how to make the proper fixed menu work (I had serious trouble getting all the columns to space out correctly with that)…

:man_shrugging: I’m not that good at front end / design stuff, so this all got to a “least bad” situation. :flushed: :laughing:

No biggie. This is just a minor detail.
Don’t spend time on it if it’s not an easy fix. :slightly_smiling_face:

I am very happen with the feature that I can now use full screen mode with the blue city line still around it and can enlarge it step by step. Wonderfull.
Also the percentage and number of streets in a city and total streets run in one overview. That’s is what we want.
I still miss the 2 places behind the decimal point but hope that will come also :slight_smile:

I just noticed the decimal place in percent completed as well as number of streets completed, love it! I do miss the bigger map associated with an activity or a city. On a mobile phone, that is. The map used to have it own tab and would take up most of the screen. Now it occupies only a third or less. I use both Safari and Chrome web browser on an iPhone 7.

Yeah, the updated percentage is new from today … I haven’t announced it yet.
There’s a fair amount of fallout from today’s release that I’m trying to clean up now… :flushed: :grimacing:

I’m bummed about the loss of map space as well, but this update allows all of the interactivity to actually work. So you can tap on streets to auto-zoom into them, etc.
If I can figure out a better design that keeps the interactivity and also gives the map more space, I’ll run with it… This is the best I could do for now, though.